Learn JTAG Basics with Trainer 1149!
With Trainer 1149 you can:
- Look inside Boundary Scan cells
- Walk through TAP controller states
- Play with Boundary Scan controller
- Inject faults and observe their effects
- Connect your hardware and control it
- Build your programs and execute SVFs
- Create your own board and simulate it
- Import your BSDL files (see www.bsdl.info)
Quick Start Guide
Running Trainer 1149
After installing this software, please go to Windows Start Menu -> All Programs -> Trainer 1149 and click "Trainer 1149" shortcut to run the program.
If you are using Linux operating system, type the following command in the program's installation directory:
java -jar trainer1149.jar
Note, that Java Runtime Environment has to be set up properly on your computer.
After Trainer 1149 is started the Welcome Menu appears. You can select "Open Example Project" item to proceed with sample project.
Now you are working with "example_project" project. To switch to another project select File->Open menu.
Working modes
There are three working modes supported by Trainer 1149:
- Project Mode - allows you to view/organize your project items, create or import new files
- Debug Mode - is used to perform Boundary Scan operations on currently opened netlist: select instructions, perform scan, define test vectors, observe diagnostic results, etc
- Board Edit Mode - intended to create/edit your own netlists
To change the working mode select appropriate item in the Mode menu. Another way is two use special toolbar buttons:
Your should start your work with Project Mode to choose the netlist first.
Opening netlist
As a first step you should choose some netlist to work with. Expand the Project Explorer tree to Netlists group and choose one of the available netlists:

Netlists are stored in files with .NL extension.
To open netlist - just double click on it. Shortly after, the Boundary Scan part of the board become visualized in the Board panel.
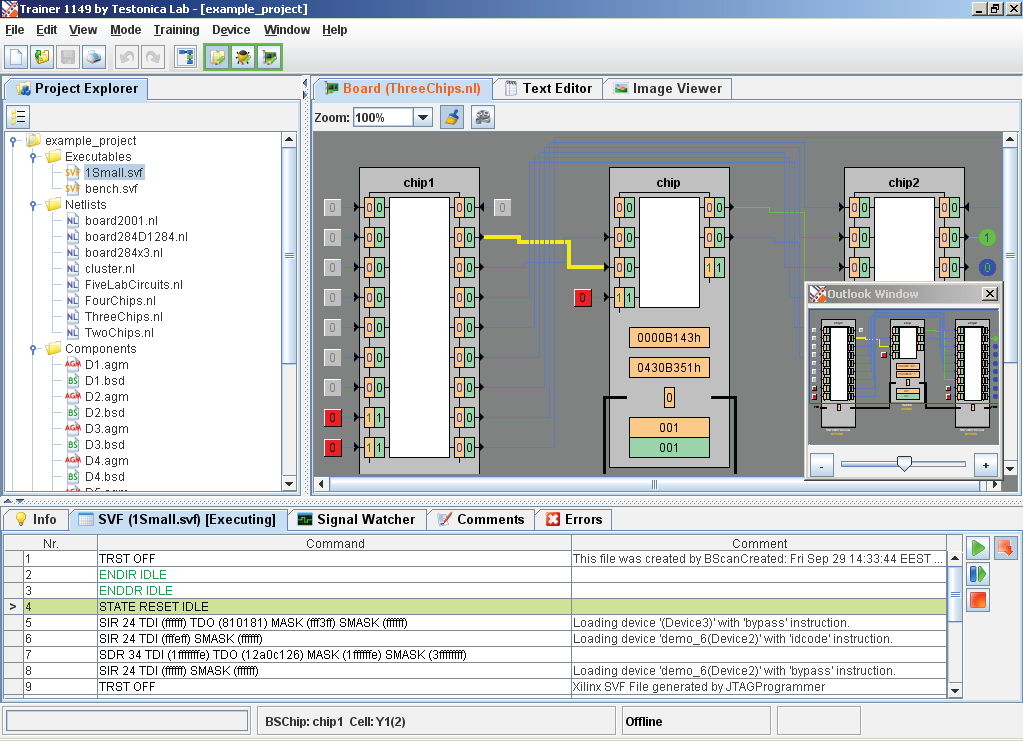
Board
After netlist is opened the Boundary Scan part of board become visualized. You can see BS chips, BS cells, Instruction and Bypass registers, IDCODE/USERCODE registers (if present), connections between chips, external I/O etc. If the description of internal logic is present in the board descirption the full simulation become available.
The colors of signal lines will represent a current values of signals.
You can also click on input pins to change the input values.
Performing BS operations
To perform BS-related operations you need to swicth to the Debug Mode.
Test Constructor panel will appear in the left:
Here you can specify instructions for each of BS chips and shifting values (test patterns). After that, press the Run button to perform scan (you can also perform Scan IR and
Scan DR operations separately by pressing corresponding buttons).
Also you can select instructions and input scan values directly on the board by mouse clicks:
img src="/sites/default/files/images/1149/guide/board2.gif" alt="Board 2"/>
The results of scans are displayed in the Diagnostic Results panel in the bottom:
Working with TAP controller
You can work with Boundary Scan by accessing TAP controller directly.
Go to Window->Tap state diagram menu (or press appropriate button in the toolbar). TAP state diagram become visible.
Click TDI and TMS buttons to change input signals. After TCK button is pressed the clock cycle will be generated and controller might change its state. Pressing TCK button while Shift is holded down will generate clock edges.
You can speed-up your work with TAP controller by clicking on hightlighted states. In the last case the software will generate needed sequence of TCK/TMS signals automatically.
You can see how signals and TAP state changes in the Signal Watcher:
Injecting faults
The following fault types can be injected:
- Opens (stuck-at model)
- Shorts (Wired-OR, Wired-AND or Dominant models)
To inject fault choose Training->Inject Fault... menu item. In the special dialog you can select fault type and location or inject a random fault.
After that you can try to identify fault by using means of Bounary Scan. To check your guess, use Training->Check Fault menu item.
To remove the injected fault from the board useTraining->Remove Injected Fault menu item.
Further info
Certainly one can do much more with Trainer 1149 than it is described above.
Check the Technical Documentation to learn more.
Request additional information from bscan@testonica.com.